IVE HAD A FEW PEEPS ASK ME IF I KNOW HOW LAGO-METER WORKS, WTF DOES IT TELL ME.
WELL IVE PINCHED THE BELOW INFO FROM BANIMOD FORUMS SO I CAN POINT PEOPLE TO THIS THREAD FOR INFO.
Enemy Territory provides a small graph with some network information which can be enabled by setting cg_lagometer to 1. Although this is not a feature specific to ET Pro, it has never been well-documented.
The lagometer consists of two graphs--the upper is the frame graph, and the lower is the snapshot graph. New data is added to the frame graph every time the client renders a frame (so this graph will move faster at higher framerates), and new data is added to the snapshot graph every time a snapshot packet is received from the server.
The snapshot graph is the easiest to understand--it is essentially a graph of the latency (ping) between you and the server. The graph's colors provide some additional information: green is normal, yellow indicates that the snapshot was delayed so that the server would not exceed the rate value (either rate on your client, or sv_maxRate on the server, whichever is lower), and red indicates that a snapshot was lost entirely (i.e. a snapshot sent by the server never made it to the client, probably due to network problems.)
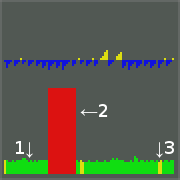
In the above image, arrow 1 points to a normal snapshot with a ping of about 130ms, arrow 2 points to 700ms of packet loss, and arrow 3 points to 2 snapshots that were delayed to stay under the rate limit.
The frame graph is a little more complicated, and requires some background information about how Enemy Territory's network code works for a full understanding. In Enemy Territory, each client runs at a non-fixed frame rate (depending on configuration, system performance, etc.) while the server runs at a fixed rate of 20 frames per second. After running each frame, the server will send a snapshot to every client (so long as the client's snaps and rate settings allows it) describing everything that has changed since the previous snapshot. When the client receives this snapshot, it interpolates the values between the old snapshot and the snapshot that was just received--that is, it smooths out the movement so that things in the map don't appear to be jumping around when the client is drawing frames faster than the server is sending them. If the client doesn't receive a snapshot, it may have to guess where an object is going to be in order to keep things looking normal.
The client and the server each keep track of the current game time, and the differences between these times are expressed in the frame graph as well as object movement. For a simple example of this, imagine that the server has sent you two snapshots, snapshot a at time 12350, and snapshot b at time 12400?, and then imagine that the client's current time is 12375. The client will interpolate? the position sent in snapshot a and in snapshot b to determine that the object in question should be drawn in the middle of the two points sent (because 12375 (the time our client is drawing for) is exactly halfway between 12350 and 12400.)
In the situation presented in the previous paragraph, imagine the client's time is 12425 and that no additional snapshots have been received yet. In order to maintain fluid motion, the client will need to guess where objects will be (using the last known position, angle, and velocity.) The calculation for this is quite not as easy to explain, so an example has been omitted for brevity.
The frame graph in the lagometer represents how far the time used for currently drawn image is away from the most recently received snapshot, and whether the client interpolated or extrapolated to obtain the positions used. Normally, the client interpolates positions, which is represented in blue on the lagometer; the graph height will spike downwards when a new snapshot is received, then crawl upwards towards the baseline), although it will sometimes be yellow to indicate extrapolation (and the graph will crawl upwards away from the baseline as the client extrapolates farther and farther from the last known data.) Since the cl_timenudge cvar causes the world to be rendered a certain number of milliseconds behind or ahead of the client's internal time, negative values may cause extrapolation during normal gameplay. For example, in the first situation described above (where the client's time is 12375), a cl_timenudge value of -30 would end up pushing the time used for rendering up to 12405 (which is newer than the data we have), so a small amount of extrapolation (5ms) would be required here.
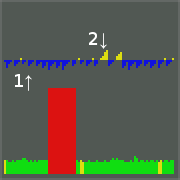
In the above image, arrow 1 points to an interpolated frame immediately after a new snapshot was received, and arrow 2 points to a frame where a fair bit of extrapolation was performed.
Footnotes:
? Note the increase of exactly 50 -- remember that the server is running at 20 frames per second, so:
1 frame ? 1000ms (1 second)
--------------------------------------------------------------------------------
20 frames = 50ms
? This is technically called linear interpolation (the simplest interpolation method), which is sometimes abbreviated to lerping.
CREDIT /- RAIN @ BANIMOD
WELL IVE PINCHED THE BELOW INFO FROM BANIMOD FORUMS SO I CAN POINT PEOPLE TO THIS THREAD FOR INFO.
Enemy Territory provides a small graph with some network information which can be enabled by setting cg_lagometer to 1. Although this is not a feature specific to ET Pro, it has never been well-documented.
The lagometer consists of two graphs--the upper is the frame graph, and the lower is the snapshot graph. New data is added to the frame graph every time the client renders a frame (so this graph will move faster at higher framerates), and new data is added to the snapshot graph every time a snapshot packet is received from the server.
The snapshot graph is the easiest to understand--it is essentially a graph of the latency (ping) between you and the server. The graph's colors provide some additional information: green is normal, yellow indicates that the snapshot was delayed so that the server would not exceed the rate value (either rate on your client, or sv_maxRate on the server, whichever is lower), and red indicates that a snapshot was lost entirely (i.e. a snapshot sent by the server never made it to the client, probably due to network problems.)
In the above image, arrow 1 points to a normal snapshot with a ping of about 130ms, arrow 2 points to 700ms of packet loss, and arrow 3 points to 2 snapshots that were delayed to stay under the rate limit.
The frame graph is a little more complicated, and requires some background information about how Enemy Territory's network code works for a full understanding. In Enemy Territory, each client runs at a non-fixed frame rate (depending on configuration, system performance, etc.) while the server runs at a fixed rate of 20 frames per second. After running each frame, the server will send a snapshot to every client (so long as the client's snaps and rate settings allows it) describing everything that has changed since the previous snapshot. When the client receives this snapshot, it interpolates the values between the old snapshot and the snapshot that was just received--that is, it smooths out the movement so that things in the map don't appear to be jumping around when the client is drawing frames faster than the server is sending them. If the client doesn't receive a snapshot, it may have to guess where an object is going to be in order to keep things looking normal.
The client and the server each keep track of the current game time, and the differences between these times are expressed in the frame graph as well as object movement. For a simple example of this, imagine that the server has sent you two snapshots, snapshot a at time 12350, and snapshot b at time 12400?, and then imagine that the client's current time is 12375. The client will interpolate? the position sent in snapshot a and in snapshot b to determine that the object in question should be drawn in the middle of the two points sent (because 12375 (the time our client is drawing for) is exactly halfway between 12350 and 12400.)
In the situation presented in the previous paragraph, imagine the client's time is 12425 and that no additional snapshots have been received yet. In order to maintain fluid motion, the client will need to guess where objects will be (using the last known position, angle, and velocity.) The calculation for this is quite not as easy to explain, so an example has been omitted for brevity.
The frame graph in the lagometer represents how far the time used for currently drawn image is away from the most recently received snapshot, and whether the client interpolated or extrapolated to obtain the positions used. Normally, the client interpolates positions, which is represented in blue on the lagometer; the graph height will spike downwards when a new snapshot is received, then crawl upwards towards the baseline), although it will sometimes be yellow to indicate extrapolation (and the graph will crawl upwards away from the baseline as the client extrapolates farther and farther from the last known data.) Since the cl_timenudge cvar causes the world to be rendered a certain number of milliseconds behind or ahead of the client's internal time, negative values may cause extrapolation during normal gameplay. For example, in the first situation described above (where the client's time is 12375), a cl_timenudge value of -30 would end up pushing the time used for rendering up to 12405 (which is newer than the data we have), so a small amount of extrapolation (5ms) would be required here.
In the above image, arrow 1 points to an interpolated frame immediately after a new snapshot was received, and arrow 2 points to a frame where a fair bit of extrapolation was performed.
Footnotes:
? Note the increase of exactly 50 -- remember that the server is running at 20 frames per second, so:
1 frame ? 1000ms (1 second)
--------------------------------------------------------------------------------
20 frames = 50ms
? This is technically called linear interpolation (the simplest interpolation method), which is sometimes abbreviated to lerping.
CREDIT /- RAIN @ BANIMOD
